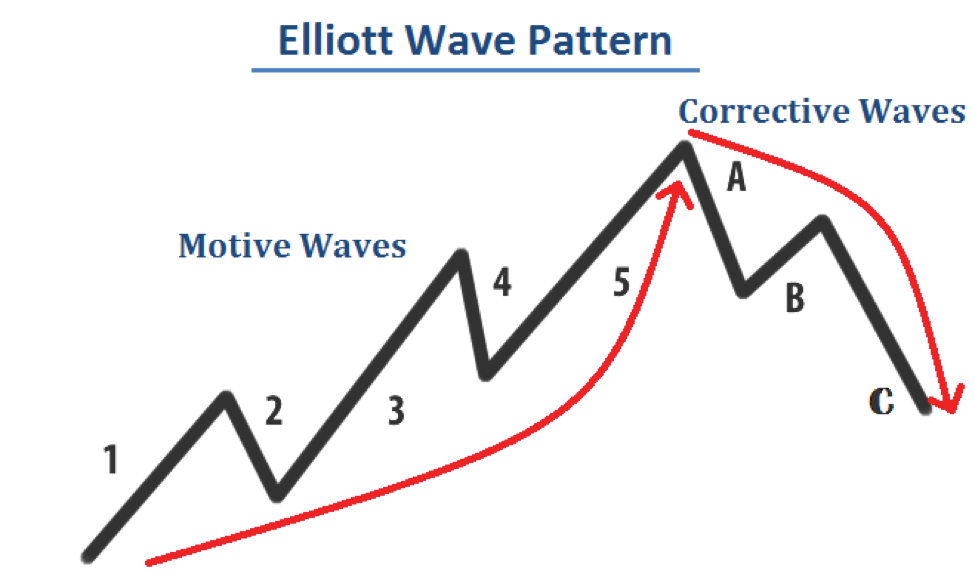
The Elliott wave pattern is like a roadmap for how a stock behaves. All stocks follow a basic pattern of five waves, split into two main phases: the motive phase and the corrective phase.
For swing traders like us, the motive phase is where the action is. This is where the Elliott wave theory perfectly aligns with my favorite kind of trade: The First Pullback Trade.
Let’s break it down a bit with a visual:

The Elliott Wave Phases:
The motive phase has five waves, numbered 1 through 5. Think of it as a close-up view of an uptrend.
The corrective phase, labeled Wave A, Wave B, and Wave C, is the part that “corrects” the uptrend. We’re not super focused on this part, but it’s good to know about!
Now, let’s talk about each wave:
Wave One:
This wave kicks off a new uptrend, breaking the previous downtrend. It’s like the starting gun for the trend. This is when we start keeping an eye out for a pullback.
Wave Two:
Here comes the pullback! We start looking for entry points using candlestick patterns. This sets us up for our First Pullback scenario, where we jump in at the beginning of an uptrend.
Wave Three:
Wave three is the big kahuna of the Elliott wave cycle. It’s the longest and strongest of all the waves! That’s why we want to hop on during wave two (the pullback) as wave three is just starting.
Wave Four:
Wave four is a bit of a letdown for folks who jumped in too late. The stock slows down, signaling that the best part of the trend might be over.
Wave Five:
This wave usually isn’t as exciting as wave three. It’s the last burst of buying before the stock starts heading down again.
Waves A, B, and C:
These waves kick off the downtrend. Wave A might look like a regular pullback but is a bulltrap. Wave B doesn’t go higher than wave 5, and wave C is the third wave in a downtrend! This is where we start looking for opportunities to short the stock.
And there you have it, the basic structure of an Elliott wave pattern. There’s more to it, but some can get pretty complicated. Plus, figuring out exactly which part of the cycle a stock is in can be tricky!
Here are some more Elliott Wave articles that you might enjoy reading…
The Most Important Investment Event You’ll Attend this Year
Sign up for the State of the U.S. Markets Online Conference to prepare for this year’s macro trends and get instant access to a free video presentation from market legend Robert Prechter ? all from the comfort of your favorite chair. Claim your invite and watch the free video now.
Get Your Special Report: What You Need to Know NOW About Protecting Yourself from Deflation
Special Report about the Unexpected But Imminent and Grave Risk to Your Portfolio PLUS 29 Specific Forecasts for Stocks, Real Estate, Gold, New Cultural Trends — and More (excerpted from Prechter’s New York Times bestseller Conquer the Crash — You Can Survive and Prosper in a Deflationary Depression)
Have questions, suggestions, or topics you’d like us to cover? We’d love to hear from you! Please check About us.
Disclaimer:
The information provided in this finance blog is for general informational purposes only. It does not constitute financial advice, and readers are encouraged to consult with a qualified financial advisor for personalized guidance. The author is not liable for any financial decisions or actions based on this blog’s content. Investments involve risks, and past performance is not indicative of future results. Always conduct thorough research and consider your financial circumstances before making any investment decisions.


1 thought on “Learn the Basic Elliott Wave Pattern in 2024”