Let’s simplify moving averages and how they can help us in trading:
Moving averages serve two main purposes: they help us identify trends and spot changes in those trends. That’s pretty much it – anything beyond that is just wasting your time.
I won’t dive into the nitty-gritty of how they’re calculated because there are tons of websites out there that cover the math behind them. You can explore that on a rainy day when you’ve got nothing else to do! But essentially, a moving average line is just the average price of a stock over a certain period of time. Easy, right?
The two moving averages:
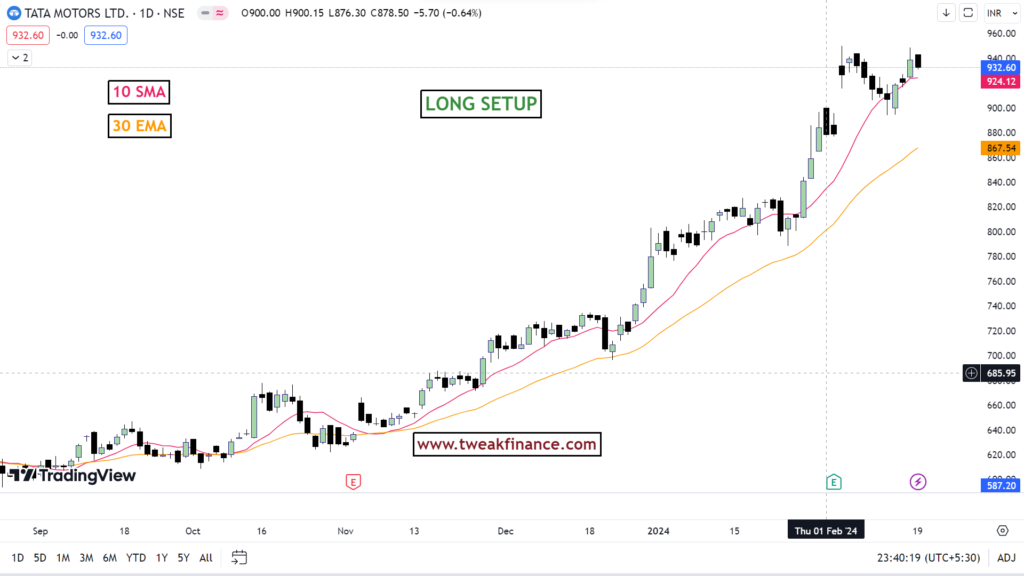
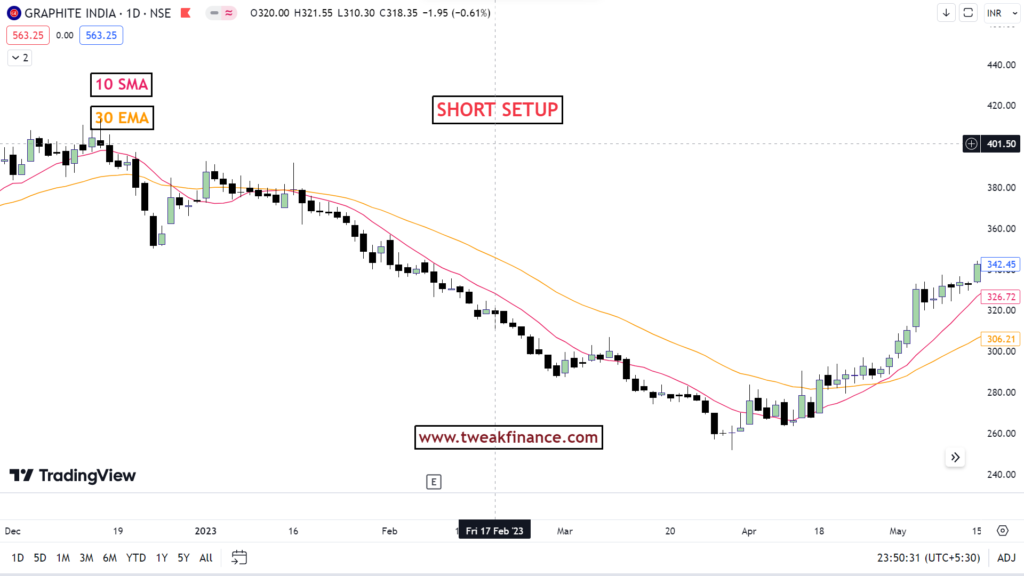
Now, let’s talk about the two moving averages I use: the 10-period simple moving average (SMA) and the 30-period exponential moving average (EMA). I like to use a faster one and a slower one because when the faster one (10) crosses over the slower one (30), it often signals a change in trend.
Check out this chart:

See how these lines help us spot trends? When the 10 SMA is above the 30 EMA, the trend is up, and when it crosses below, the trend shifts downward. It’s as simple as that!
Here are the rules:
Let’s simplify things when it comes to trading with moving averages.
If you’re looking to go long on a stock, make sure the 10 SMA (simple moving average) is above the 30 EMA (exponential moving average).

On the flip side, if you’re considering shorting a stock, wait until the 10 SMA drops below the 30 EMA. It’s a straightforward rule that always keeps you on the right side of the trend!

But here’s the catch: moving averages work best when a stock is trending. If things get choppy and the stock starts moving sideways (or if the market itself gets “sloppy”), forget about using moving averages – they won’t be reliable.
Here are the important things to remember (for long positions – reverse for short positions.):
- The 10 SMA should be above the 30 EMA.
- There should be a decent gap between the two moving averages.
- Both moving averages should be pointing upwards.
Remember these points, and you’ll be better equipped to ride the trend like a pro!
The 200-period moving average
Let’s talk about the 200-period moving average.
The 200 SMA is pretty important in the world of trading. It helps us figure out if we’re in bull territory or bear territory. Research shows that focusing on long positions when the price is above this line and short positions when it’s below can give us a little edge.
It’s a good idea to add this moving average to all your charts, no matter what time frame you’re looking at – whether it’s weekly, daily, or even intra-day charts (like 15-minute or 60-minute charts).
Seriously, the 200 SMA can be a game-changer. You’d be surprised how many times a stock will turn around when it hits this line. So, keep an eye on it!
And here’s a pro tip: when you’re scanning for stocks, use the 200 SMA as an extra filter. Look for potential long setups above this line and potential short setups below it. It can help you make smarter trading decisions.
Support and resistance?
Contrary to what some traders might think, stocks don’t magically find support or resistance at moving averages. You might hear people say, “Hey, look! The stock bounced off the 50-day moving average!”
But here’s the truth: stocks don’t bounce off lines drawn on a chart by traders. Instead, they tend to bounce off significant price levels from the past.
So, when you see a stock pulling back to, let’s say, the 200-period moving average, don’t focus solely on that line. Look at the price levels on the chart that acted as strong support or resistance in the past – those are the areas where the action is likely to happen.
Have questions, suggestions, or topics you’d like us to cover? We’d love to hear from you! Please check About us.
Disclaimer:
The information provided in this finance blog is for general informational purposes only. It does not constitute financial advice, and readers are encouraged to consult with a qualified financial advisor for personalized guidance. The author is not liable for any financial decisions or actions based on this blog’s content. Investments involve risks, and past performance is not indicative of future results. Always conduct thorough research and consider your financial circumstances before making any investment decisions.

